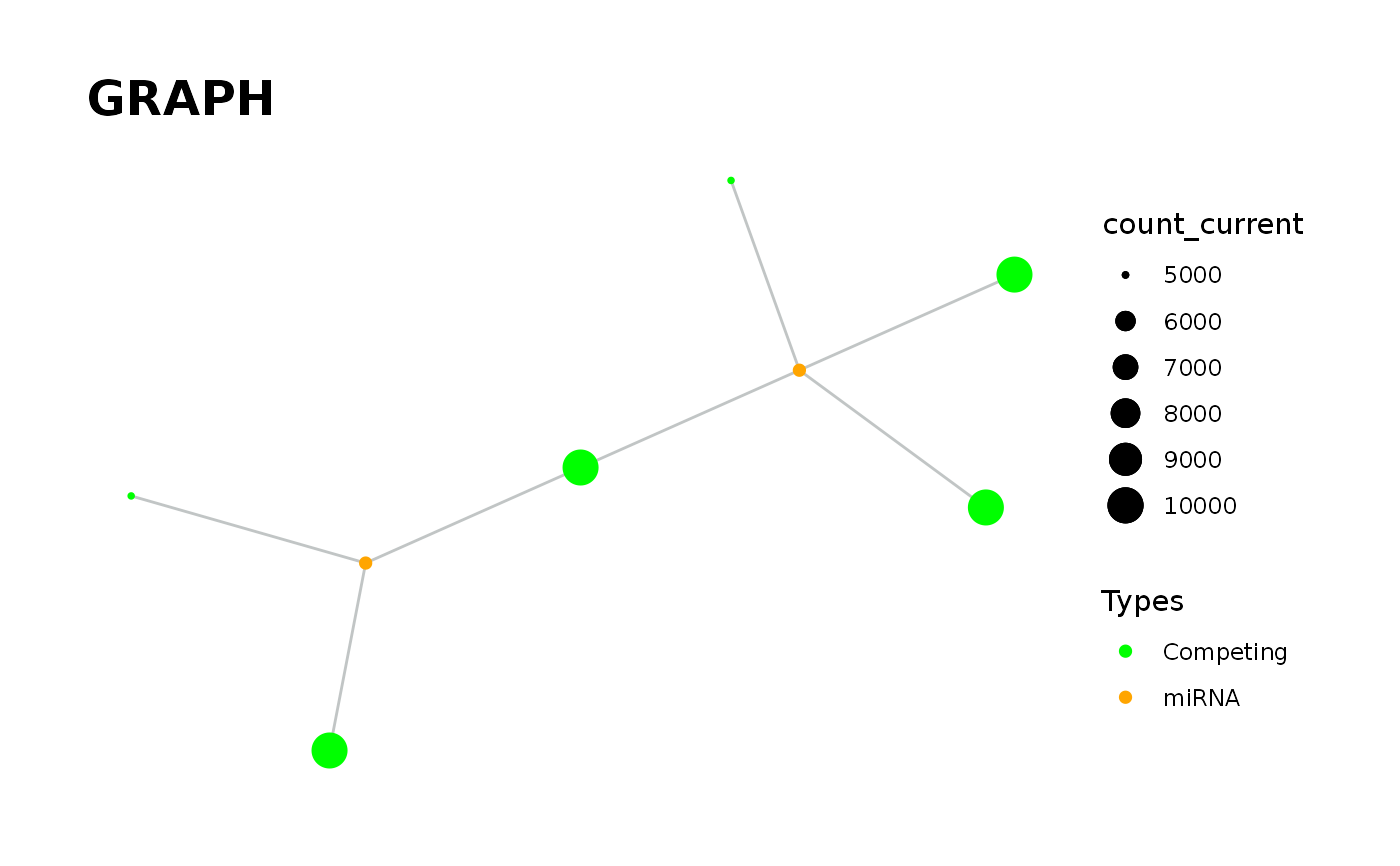
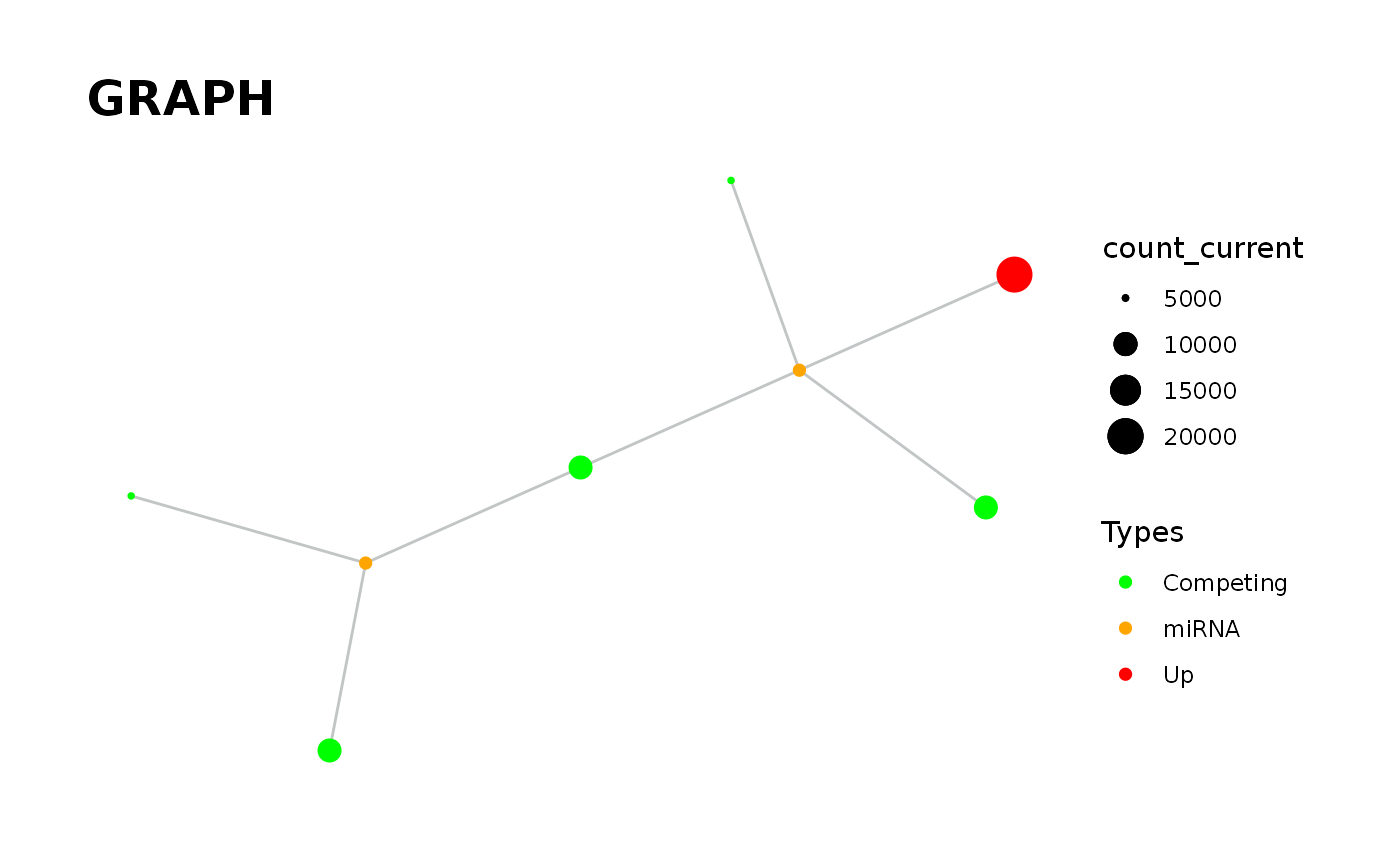
`vis_graph` Provides visualisation of the graph.
vis_graph(
  input_graph,
  Competing_color = "green",
  mirna_color = "orange",
  Upregulation = "red",
  Downregulation = "blue",
  title = "GRAPH",
  layout = "kk"
)
Arguments
| input_graph | The graph object. |
|---|---|
| Competing_color | The color of competing elements on the graph with 'green' default. |
| mirna_color | The color of miRNAs on the graph with 'orange' default. |
| Upregulation | The color of Upregulated elements on the graph with 'red' default. |
| Downregulation | The color of Downregulated elements on the graph with 'blue' default. |
| title | Title of the given graph. |
| layout | The layout that will be used for visualisation of the graph. |
Value
The graph object.
Details
vis_graph ensures the process to be followed.
Examples
data('minsamp') data('new_counts') # Visualisation of graph in steady-state. priming_graph(minsamp, Competing_expression, miRNA_expression, aff_factor = c(seed_type,energy), deg_factor = region)%>% vis_graph()#> Warning: Kamada-Kawai (kk) layout was used.#> Warning: First column is processed as competing and the second as miRNA.# Visualisation of graph after the change. priming_graph(minsamp, Competing_expression, miRNA_expression, aff_factor = c(seed_type,energy), deg_factor = region)%>% update_variables(new_counts)%>% vis_graph()#> Warning: Kamada-Kawai (kk) layout was used.#> Warning: First column is processed as competing and the second as miRNA.